
The housing market in August resembled a game of musical chairs, as high home prices and low mortgage rates began to draw more sellers to the market: New listings climbed 5%, fueling a 30% increase in pending sales.
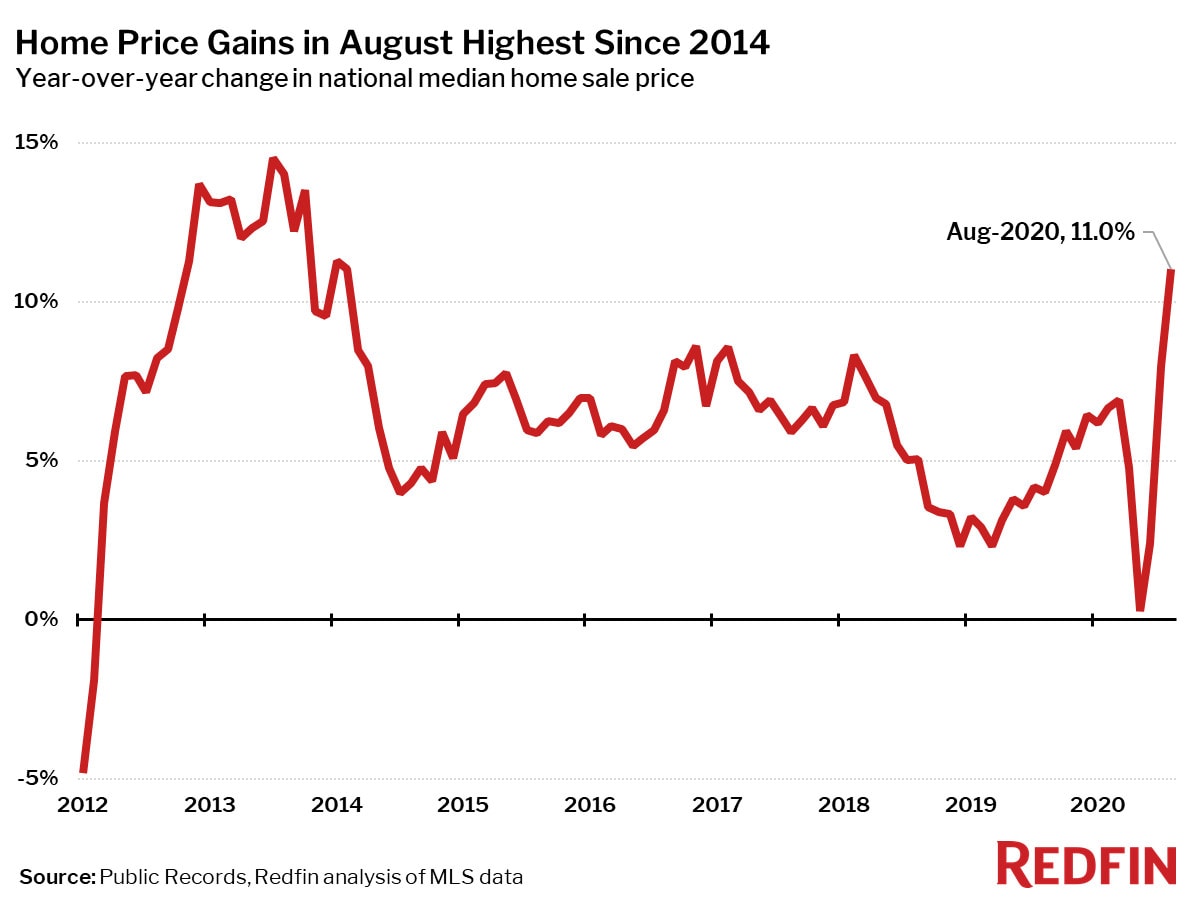
The national median home price rose 11% year over year to $328,400 in August—the largest annual increase since February 2014. As has been the case for most of the summer, low mortgage rates drove homebuyer demand, but the supply of homes for sale has fallen to another new low.
“The supply of homes is tighter than ever and home prices are growing at the fastest rate in years. Why isn’t this historic seller’s market holding back buyers?” said Redfin lead economist Taylor Marr. “Homeowners are just now deciding to sell; they were just a little late to the game. These new listings have supplied buyers with homes to purchase. High prices almost always eventually draw sellers to market and with record low rates, trading out your home for a new mortgage can be more attractive than refinancing.”
Median prices increased in every single one of the 85 largest metro areas Redfin tracks. The smallest increase was in New York (+2.7%). Meanwhile, Bridgeport, CT (+30.7%), Memphis, TN (+20.5%) and Tulsa, OK (+19.8%), saw the largest year-over-year increases.
| Market Summary | August 2020 | Month-Over-Month | Year-Over-Year |
|---|---|---|---|
| Median sale price | $328,400 | 1.7% | 11.0% |
| Homes sold, seasonally-adjusted | 585,098 | 2.2% | 10.2% |
| Pending sales, seasonally-adjusted | 573,500 | 10.4% | 29.8% |
| New listings, seasonally-adjusted | 641,900 | 2.2% | 4.6% |
| All Homes for sale, seasonally-adjusted | 1,677,400 | -2.3% | -22.0% |
| Median days on market | 31 | -4 | -8 |
| Months of supply | 1.6 | 0 | -1 |
| Sold above list | 32.0% | 2.1 pts† | 8.2 pts† |
| Median Off-Market Redfin Estimate | $315,800 | 2.1% | 4.4% |
| Average Sale-to-list | 99.3% | 0.2 pts† | 0.8 pts† |
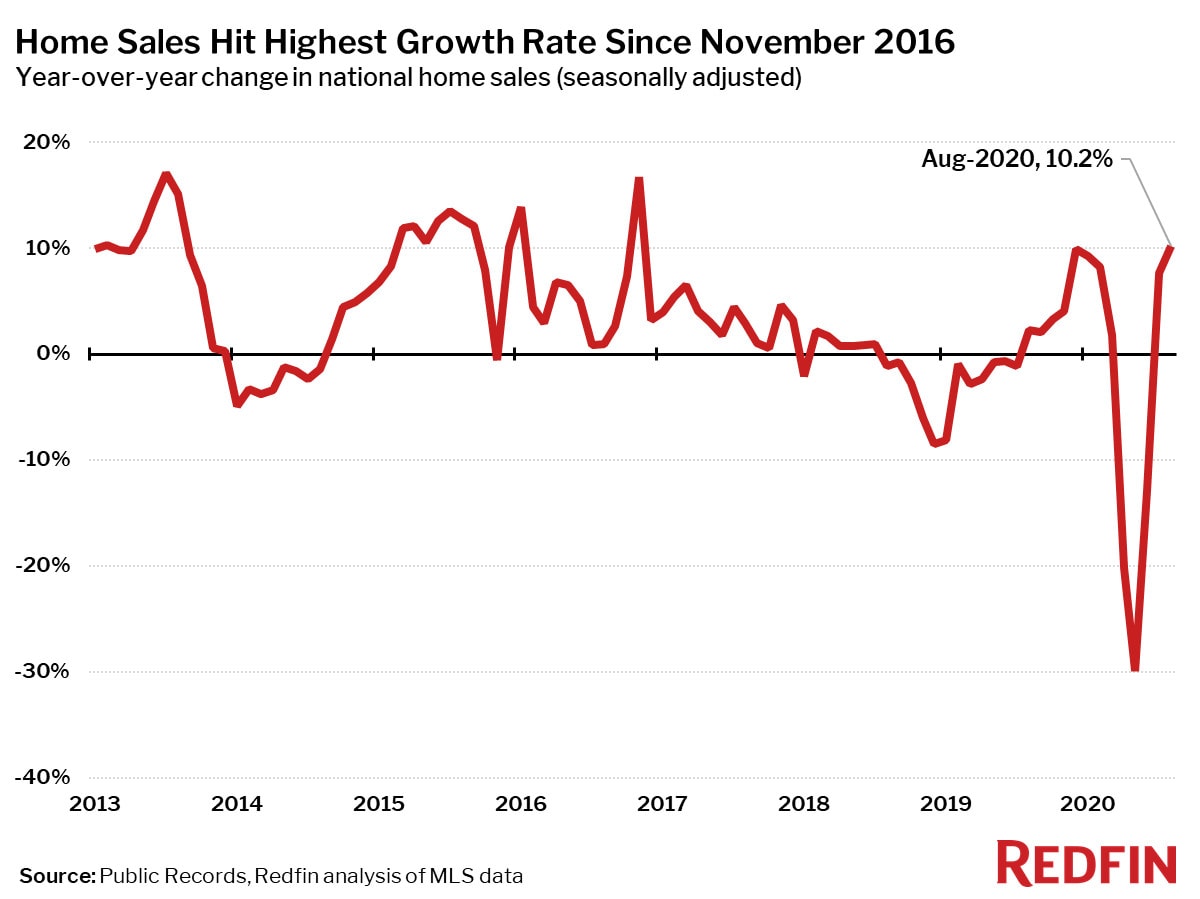
Home sales were up 10.2% in August from a year earlier on a seasonally-adjusted basis, the largest increase in nearly four years.
Home sales increased in August from a year earlier in 56 of the 85 largest metro areas—a slight decrease from July. The largest gains in sales were in Bridgeport, CT (+38.8%), Lake County, IL (+24.5%) and Chicago (+17.1%). The list of markets where sales are falling the most continued to be dominated by New York State, led by Nassau County, NY (-27.5%), Buffalo, NY (-23.7%) and Rochester, NY (-22.6%).
Active listings—the count of all homes that were for sale at any time during the month—fell 22.0% year over year to their lowest level on record in August, the 12th-straight month of declines. The supply shortage continued to worsen because buyers bought homes at a faster rate than the number of homes being listed. At the same time, a growing share of homes is selling quickly, leaving few homes lingering on the market from one month to the next.
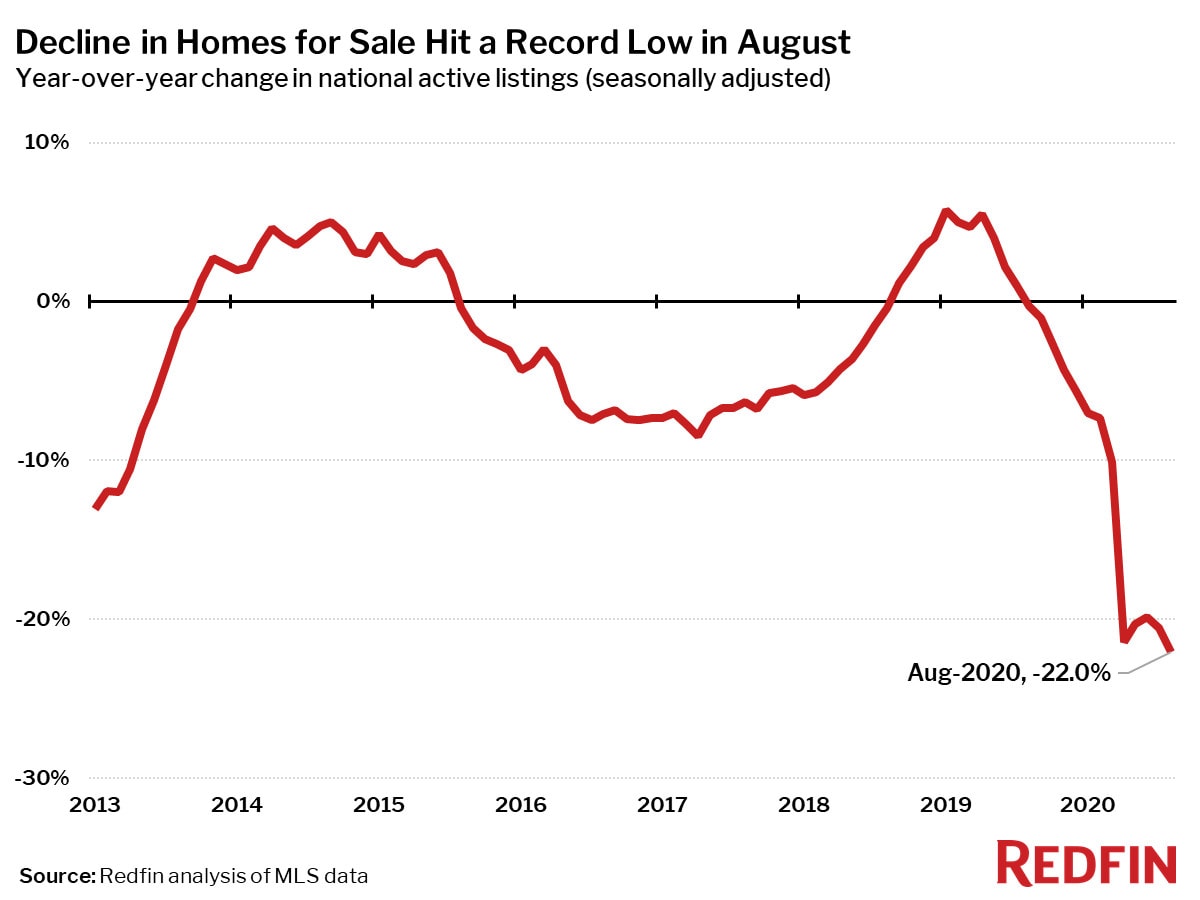
Only two of the 85 largest metros tracked by Redfin posted a year-over-year increase in the count of seasonally-adjusted active listings of homes for sale: San Francisco (+75%) and New York City (+10%). The sudden expansion of work-from-home policies due to the pandemic has led many people to flee these cities, two of the country’s most expensive housing markets.
Compared to a year ago, the biggest declines in active housing supply in July were in Allentown, PA (-55.0%), Kansas City, MO (-53.0%) and Salt Lake City (-50.5%).
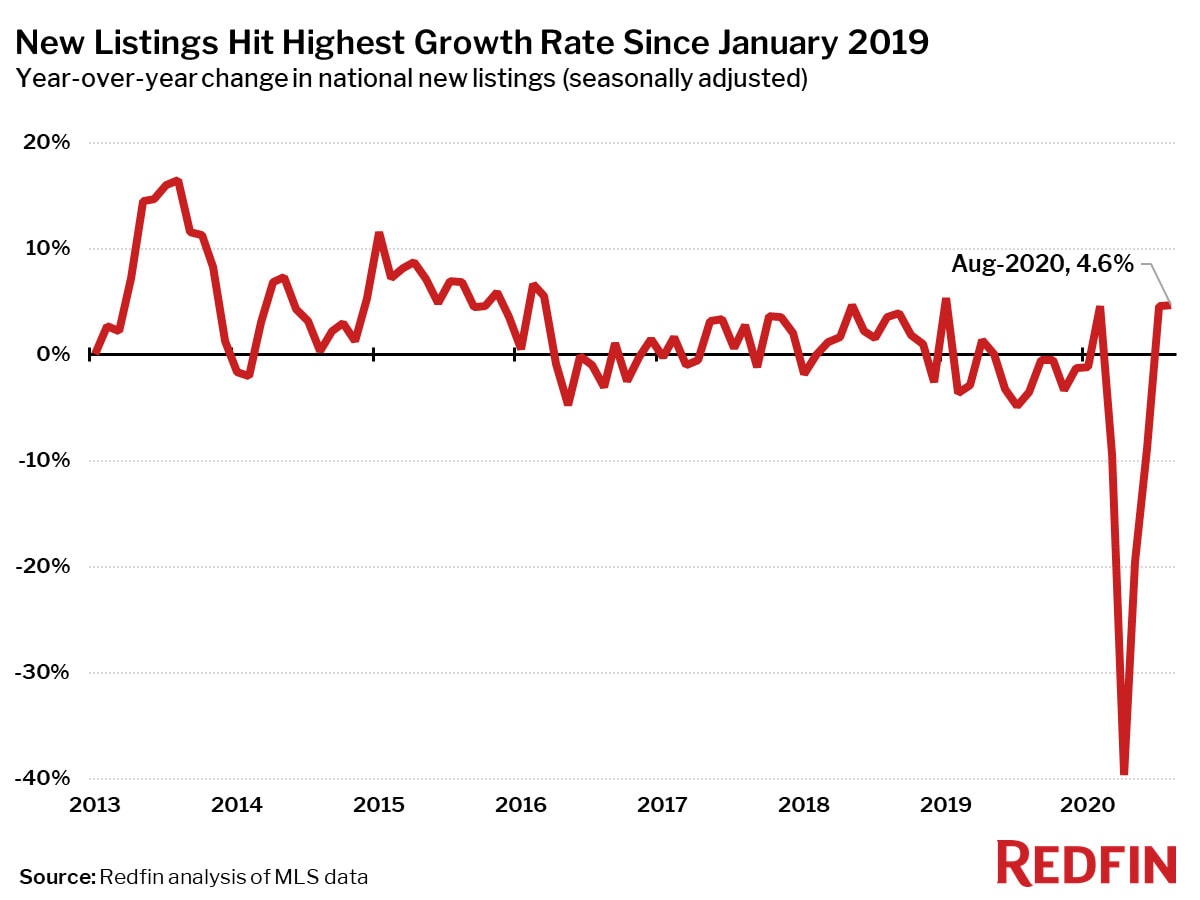
The number of new listings of homes for sale increased 4.6% in August from a year earlier, only the third such increase in the past 15 months. Pending sales were up 29.8% from August 2019.
“Some of the growth in homes for sale is fueled by San Francisco and New York, where buyers aren’t as interested right now, but these are the exceptions,” explained Marr. “In Seattle, new listings jumped 35%, fueling a 45% increase in pending sales. The housing market is like a national game of musical chairs right now, where everyone wants to jump in now that remote work and low mortgage rates have changed the rules of the game. But will the music soon stop? Can builders add more chairs if the cost of doing so is skyrocketing?“
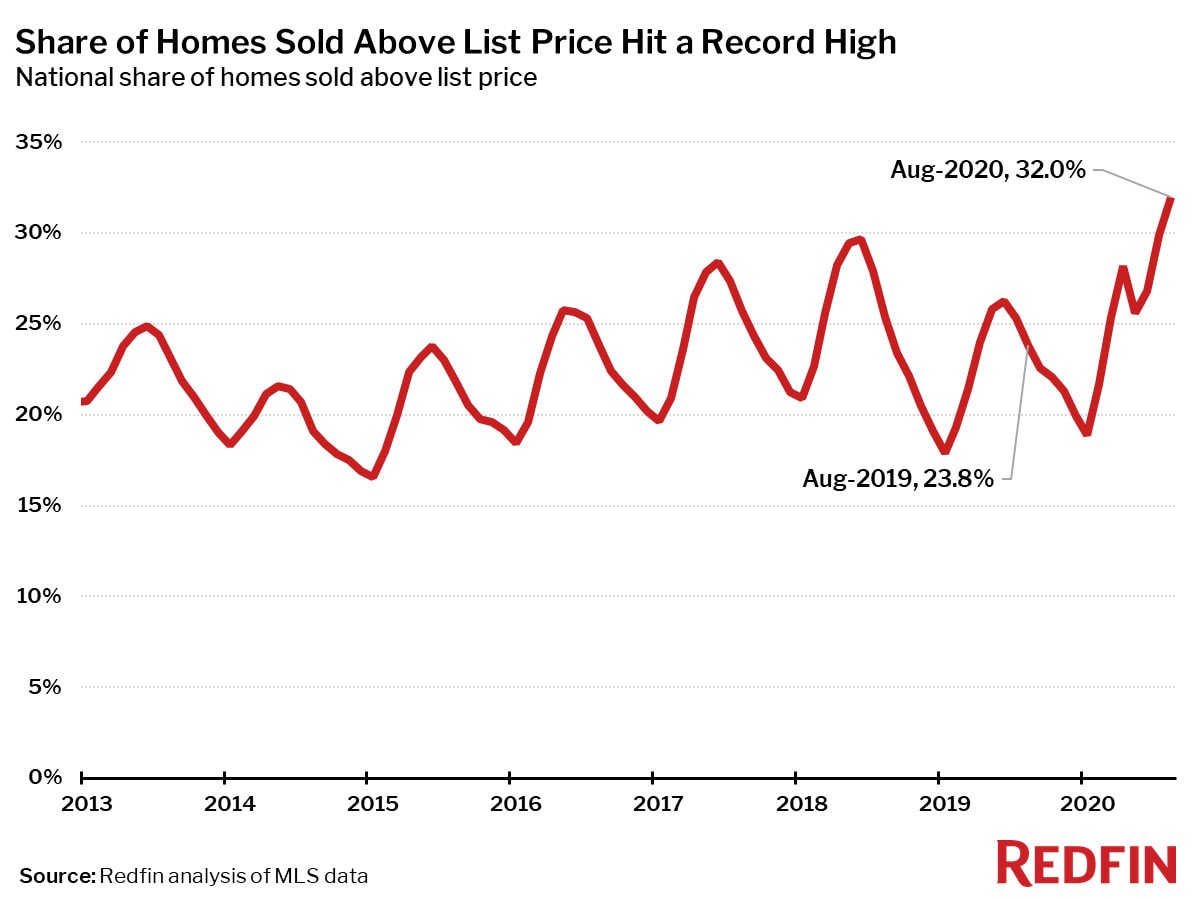
As a result of the continued imbalance between the number of homebuyers and sellers in the market, measures of competition such as time on market and the share of homes sold above list price trended toward an increasingly competitive market in August, bucking the usual seasonal trend.
The typical home that sold in August went under contract in 31 days—eight days less than a year earlier. This tied the record low (since at least 2012) that was set in June 2018.
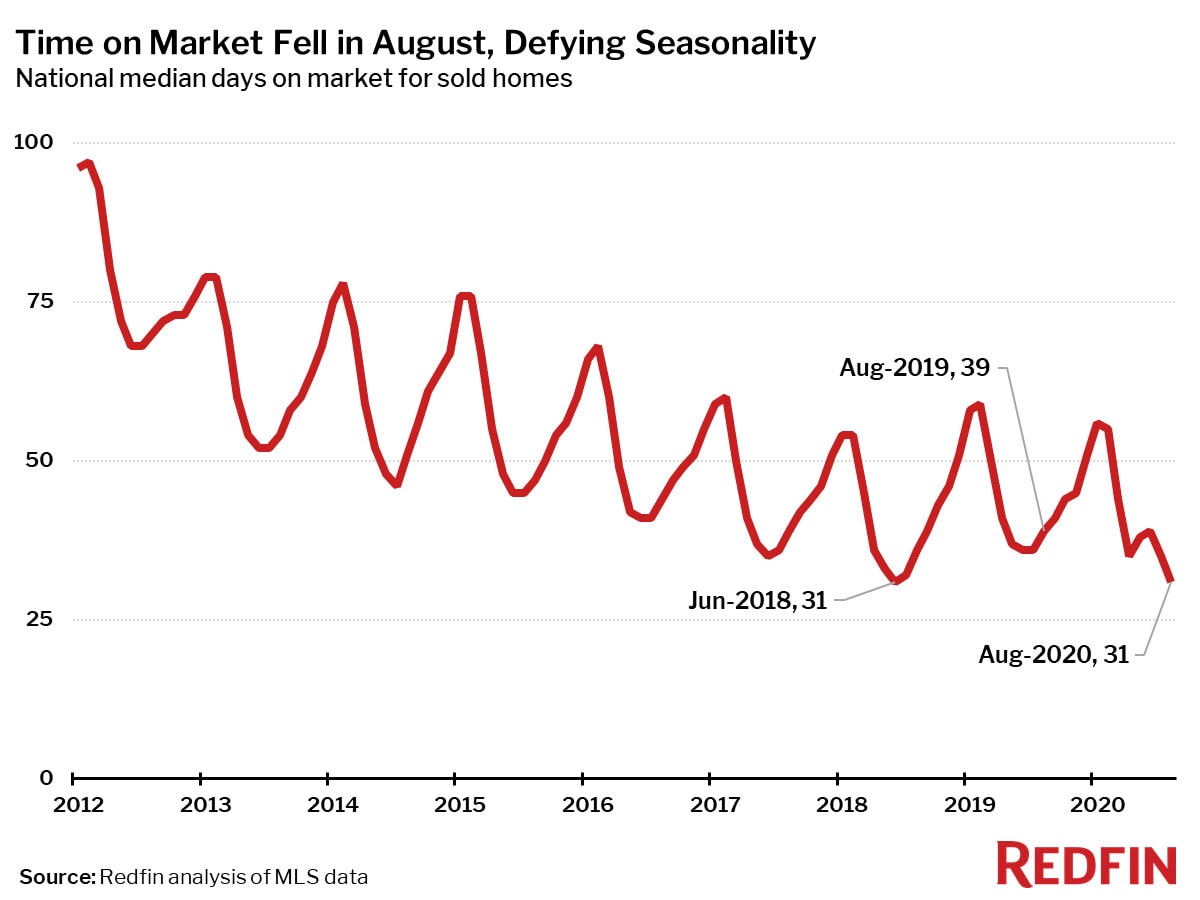
Typically by this time of year, homes spend more time on the market and the share of homes that sold above list price declines. This year, both of these measures are defying seasonality, moving in the opposite direction from their typical pattern, indicating a seller’s market that is hotter than ever.
“The market took a short break when the pandemic first hit, but over the past few months things have really picked up and just haven’t slowed down,” said Boise Redfin agent Kristin Lopez. “It seems all the West Coasters who considered moving to Idaho all decided they absolutely had to get out here ASAP. Demand has been high, but we’re down to the lowest of the low inventory, which has created a complete storm of insanity.”
In August 32.0% of homes sold above list price—the highest level in our data, which goes back through 2012—up from 23.8% a year earlier.
Other August Highlights
Competition
- Tacoma, WA was the fastest market, with half of all homes pending sale in just 6 days, down from 13 days a year earlier. Indianapolis and Grand Rapids, MI were the next fastest markets with 7 and 7 median days on market, followed by Seattle (7) and Denver (9).
- The most competitive market in August was Oakland, CA where 61.9% of homes sold above list price, followed by 58.0% in Rochester, NY, 55.2% in Tacoma, WA, 54.3% in San Jose, CA, and 53.2% in Buffalo, NY.
Prices
- Bridgeport, CT had the nation’s highest price growth, rising 30.7% since last year to $539,200. Memphis, TN had the second highest growth at 20.5% year-over-year price growth, followed by Tulsa, OK (19.8%), Cincinnati (19.5%), and Dayton, OH (17.7%).
- No metros saw price declines in August.
Sales
- Bridgeport, CT led the nation in year-over-year sales growth, up 38.8%, followed by Lake County, IL, up 24.5%. Chicago rounded out the top three with sales up 17.1% from a year ago.
- Nassau County, NY saw the largest decline in sales since last year, falling 27.5%. Home sales in Buffalo, NY and Rochester, NY declined by 23.7% and 22.6%, respectively.
Inventory
- San Francisco had the highest increase in the number of homes for sale, up 75% year over year, followed by New York (10%).
- Allentown, PA had the largest decrease in overall active listings, falling 55% since last August. Kansas City, MO (-53%), Salt Lake City (-50%), and Baton Rouge, LA (-43%) also saw far fewer homes available on the market than a year ago.
Redfin Estimate
- Miami (88.9%) had the largest share of homes predicted to sell for below list price, according to Redfin Estimate data, followed by West Palm Beach, FL (86.3%) and Fort Lauderdale, FL (85.0%).
- Oakland, CA (91.2%) had the largest share of homes predicted to sell at or above list price, followed by San Jose, CA (88.7%) and San Francisco (84.7%).
Below are market-by-market breakdowns for prices, inventory, new listings and sales for markets with populations of 750,000 or more. For downloadable data on all of the markets Redfin tracks, visit the Redfin Data Center.
Median Sale Price
| Redfin Metro | Median Sale Price | Month-Over-Month | Year-Over-Year |
|---|---|---|---|
| Albany, NY | $240,000 | 0.0% | 11.0% |
| Allentown, PA | $240,000 | 0.8% | 9.5% |
| Anaheim, CA | $798,500 | 4.7% | 13.3% |
| Atlanta, GA | $280,000 | 1.1% | 12.0% |
| Austin, TX | $354,900 | 0.2% | 10.9% |
| Bakersfield, CA | $275,000 | 1.9% | 12.2% |
| Baltimore, MD | $325,000 | 1.6% | 11.1% |
| Baton Rouge, LA | $225,000 | 1.2% | 7.8% |
| Birmingham, AL | $240,000 | -0.6% | 10.1% |
| Boston, MA | $569,000 | 2.5% | 9.8% |
| Bridgeport, CT | $539,200 | 10.0% | 30.7% |
| Buffalo, NY | $190,000 | 5.6% | 11.8% |
| Camden, NJ | $235,000 | 2.2% | 14.6% |
| Charlotte, NC | $298,000 | 1.4% | 12.9% |
| Chicago, IL | $285,000 | 1.4% | 11.8% |
| Cincinnati, OH | $227,000 | 2.7% | 19.5% |
| Cleveland, OH | $179,900 | 2.8% | 10.3% |
| Columbus, OH | $250,000 | -1.9% | 13.6% |
| Dallas, TX | $325,000 | 0.9% | 10.2% |
| Dayton, OH | $166,000 | -0.6% | 17.7% |
| Denver, CO | $455,000 | 0.0% | 8.3% |
| Detroit, MI | $160,300 | -2.8% | 10.8% |
| El Paso, TX | $183,000 | 1.8% | 10.9% |
| Elgin, IL | $252,800 | -0.5% | 6.6% |
| Fort Lauderdale, FL | $320,500 | 0.8% | 16.5% |
| Fort Worth, TX | $267,000 | 0.8% | 6.8% |
| Frederick, MD | $439,000 | -2.2% | 3.3% |
| Fresno, CA | $315,000 | -0.2% | 12.5% |
| Grand Rapids, MI | $230,300 | -3.2% | 6.1% |
| Greensboro, NC | $209,000 | 2.5% | 16.1% |
| Greenville, SC | $243,000 | 2.5% | 8.7% |
| Hartford, CT | $260,000 | 1.4% | 13.0% |
| Honolulu, HI | $625,000 | 4.5% | 6.1% |
| Houston, TX | $266,500 | -1.7% | 6.6% |
| Indianapolis, IN | $224,100 | -0.4% | 12.7% |
| Jacksonville, FL | $263,000 | -0.8% | 8.7% |
| Kansas City, MO | $255,000 | -0.1% | 11.8% |
| Knoxville, TN | $249,900 | 1.2% | 13.6% |
| Lake County, IL | $266,200 | 0.4% | 9.6% |
| Las Vegas, NV | $310,000 | 0.3% | 7.8% |
| Los Angeles, CA | $710,000 | 1.4% | 11.5% |
| Louisville, KY | $233,200 | -0.7% | 12.4% |
| McAllen, TX | $177,100 | 1.3% | 11.7% |
| Memphis, TN | $235,000 | 6.8% | 20.5% |
| Miami, FL | $355,000 | 4.4% | 16.4% |
| Milwaukee, WI | $274,900 | 6.1% | 14.5% |
| Minneapolis, MN | $315,000 | 0.6% | 9.8% |
| Montgomery County, PA | $372,500 | 3.5% | 9.6% |
| Nashville, TN | $330,000 | 0.9% | 8.0% |
| Nassau County, NY | $515,000 | 7.3% | 8.4% |
| New Brunswick, NJ | $380,000 | 4.8% | 12.6% |
| New Haven, CT | $252,000 | 0.3% | 11.5% |
| New Orleans, LA | $245,000 | -5.4% | 5.5% |
| New York, NY | $549,500 | 2.7% | 2.7% |
| Newark, NJ | $446,000 | 8.8% | 16.1% |
| North Port, FL | $307,000 | -1.6% | 11.7% |
| Oakland, CA | $835,000 | 2.5% | 12.8% |
| Oklahoma City, OK | $215,100 | 4.0% | 14.4% |
| Omaha, NE | $237,200 | -1.1% | 9.8% |
| Orlando, FL | $286,000 | 2.1% | 9.0% |
| Oxnard, CA | $675,000 | 2.7% | 9.8% |
| Philadelphia, PA | $248,000 | 0.0% | 10.2% |
| Phoenix, AZ | $327,500 | 2.3% | 15.7% |
| Pittsburgh, PA | $201,600 | 0.3% | 9.0% |
| Portland, OR | $445,000 | 1.2% | 8.5% |
| Providence, RI | $334,900 | 3.0% | 12.0% |
| Raleigh, NC | $320,000 | 2.6% | 10.0% |
| Richmond, VA | $285,000 | -0.9% | 5.6% |
| Riverside, CA | $429,900 | 2.4% | 12.3% |
| Rochester, NY | $176,500 | 0.9% | 9.3% |
| Sacramento, CA | $468,000 | 1.4% | 11.4% |
| Salt Lake City, UT | $379,800 | -0.1% | 11.7% |
| San Antonio, TX | $258,000 | -0.7% | 9.8% |
| San Diego, CA | $655,000 | 2.1% | 10.5% |
| San Francisco, CA | $1,510,000 | 3.6% | 9.8% |
| San Jose, CA | $1,230,000 | 2.8% | 17.1% |
| Seattle, WA | $630,000 | 1.6% | 12.6% |
| St. Louis, MO | $219,000 | 1.9% | 11.7% |
| Tacoma, WA | $430,000 | 0.9% | 14.7% |
| Tampa, FL | $267,000 | 0.8% | 12.8% |
| Tucson, AZ | $255,000 | 1.2% | 13.1% |
| Tulsa, OK | $207,000 | 2.3% | 19.8% |
| Virginia Beach, VA | $269,000 | -1.5% | 8.6% |
| Warren, MI | $249,900 | 1.2% | 10.1% |
| Washington, D.C. | $465,000 | -1.1% | 12.0% |
| West Palm Beach, FL | $328,000 | 1.5% | 15.1% |
| Worcester, MA | $320,000 | 0.0% | 10.3% |
| National | $328,400 | 1.7% | 11.0% |
Homes Sold
| Redfin Metro | Homes Sold | Month-Over-Month | Year-Over-Year |
|---|---|---|---|
| Albany, NY | 1,044 | 11.3% | -7.4% |
| Allentown, PA | 1,126 | -0.3% | -4.6% |
| Anaheim, CA | 3,170 | 5.0% | 11.2% |
| Atlanta, GA | 10,876 | -8.2% | 6.7% |
| Austin, TX | 3,749 | -13.4% | 5.9% |
| Bakersfield, CA | 804 | -14.3% | -11.8% |
| Baltimore, MD | 4,519 | -7.2% | 8.7% |
| Baton Rouge, LA | 1,086 | -21.0% | 14.3% |
| Birmingham, AL | 1,579 | -10.4% | -0.9% |
| Boston, MA | 5,410 | 0.0% | -4.2% |
| Bridgeport, CT | 1,858 | 4.0% | 38.8% |
| Buffalo, NY | 1,036 | 19.1% | -23.7% |
| Camden, NJ | 2,075 | -5.9% | 2.4% |
| Charlotte, NC | 4,664 | -12.3% | -0.3% |
| Chicago, IL | 11,058 | 1.2% | 17.1% |
| Cincinnati, OH | 3,315 | -7.1% | 4.0% |
| Cleveland, OH | 3,085 | -8.7% | 0.4% |
| Columbus, OH | 3,190 | -3.5% | 2.2% |
| Dallas, TX | 7,169 | -15.0% | 8.3% |
| Dayton, OH | 1,251 | -4.4% | 8.5% |
| Denver, CO | 5,910 | -12.0% | 12.5% |
| Detroit, MI | 2,201 | -3.3% | 2.0% |
| El Paso, TX | 932 | -0.2% | 9.5% |
| Elgin, IL | 1,388 | -5.8% | 14.8% |
| Fort Lauderdale, FL | 3,095 | -4.1% | -3.7% |
| Fort Worth, TX | 3,436 | -15.8% | 1.7% |
| Frederick, MD | 1,832 | -8.9% | 4.4% |
| Fresno, CA | 857 | -3.1% | -3.6% |
| Grand Rapids, MI | 1,576 | -16.3% | -5.2% |
| Greensboro, NC | 952 | -11.5% | -1.7% |
| Greenville, SC | 1,322 | -6.1% | -3.2% |
| Hartford, CT | 1,918 | -0.7% | 14.9% |
| Honolulu, HI | 777 | -0.9% | -10.2% |
| Houston, TX | 9,268 | -15.8% | 2.8% |
| Indianapolis, IN | 3,696 | -5.9% | 6.5% |
| Jacksonville, FL | 2,864 | -14.9% | 1.2% |
| Kansas City, MO | 3,691 | -12.0% | -2.6% |
| Knoxville, TN | 1,353 | -16.3% | -3.8% |
| Lake County, IL | 1,612 | -4.3% | 24.5% |
| Las Vegas, NV | 3,505 | -11.4% | -11.8% |
| Los Angeles, CA | 6,325 | 1.0% | -4.7% |
| Louisville, KY | 1,640 | -7.1% | 3.9% |
| McAllen, TX | 356 | -5.8% | 11.9% |
| Memphis, TN | 1,228 | -14.8% | -5.6% |
| Miami, FL | 2,552 | -5.8% | -3.7% |
| Milwaukee, WI | 2,330 | -1.8% | 3.3% |
| Minneapolis, MN | 6,837 | -3.7% | -0.4% |
| Montgomery County, PA | 3,206 | 4.4% | 13.2% |
| Nashville, TN | 4,164 | -10.1% | 3.5% |
| Nassau County, NY | 2,357 | 16.6% | -27.5% |
| New Brunswick, NJ | 4,092 | 10.1% | 7.4% |
| New Haven, CT | 1,217 | -3.4% | 4.8% |
| New Orleans, LA | 1,548 | -4.6% | 14.2% |
| New York, NY | 4,651 | 19.3% | -20.2% |
| Newark, NJ | 2,979 | 14.6% | 11.4% |
| North Port, FL | 2,316 | -5.6% | 16.3% |
| Oakland, CA | 2,716 | -4.0% | 3.9% |
| Oklahoma City, OK | 2,450 | -7.5% | 10.7% |
| Omaha, NE | 1,360 | -18.0% | -8.2% |
| Orlando, FL | 4,286 | -6.7% | -2.1% |
| Oxnard, CA | 921 | 4.0% | 6.5% |
| Philadelphia, PA | 2,529 | -1.1% | 5.5% |
| Phoenix, AZ | 8,717 | -12.1% | 0.6% |
| Pittsburgh, PA | 2,989 | -7.9% | 13.2% |
| Portland, OR | 3,928 | -9.5% | 3.6% |
| Providence, RI | 2,095 | -7.1% | -6.7% |
| Raleigh, NC | 2,699 | -12.3% | 5.4% |
| Richmond, VA | 1,955 | -1.5% | 2.5% |
| Riverside, CA | 5,763 | -4.6% | 7.9% |
| Rochester, NY | 1,135 | 3.9% | -22.6% |
| Sacramento, CA | 3,356 | -8.0% | 10.8% |
| Salt Lake City, UT | 1,847 | -14.2% | -1.7% |
| San Antonio, TX | 3,347 | -15.7% | -2.6% |
| San Diego, CA | 3,648 | -4.2% | 7.2% |
| San Francisco, CA | 878 | -13.2% | 0.6% |
| San Jose, CA | 1,128 | -20.2% | -9.8% |
| Seattle, WA | 4,891 | -1.6% | 8.6% |
| St. Louis, MO | 4,406 | -4.8% | 7.1% |
| Tacoma, WA | 1,575 | 0.4% | 0.1% |
| Tampa, FL | 6,179 | -8.1% | 3.5% |
| Tucson, AZ | 1,510 | -18.9% | -3.8% |
| Tulsa, OK | 1,437 | -10.4% | 3.4% |
| Virginia Beach, VA | 2,910 | -9.3% | 13.1% |
| Warren, MI | 4,532 | -8.0% | 5.2% |
| Washington, D.C. | 7,597 | -5.5% | 10.1% |
| West Palm Beach, FL | 3,083 | -11.3% | 4.4% |
| Worcester, MA | 1,303 | 2.1% | -3.5% |
| National | 524,100 | 0.3% | 0.1% |
New Listings
| Redfin Metro | New Listings | Month-Over-Month | Year-Over-Year |
|---|---|---|---|
| Albany, NY | 1,359 | -0.4% | 18.9% |
| Allentown, PA | 558 | -39.7% | -50.3% |
| Anaheim, CA | 3,500 | -5.6% | 16.6% |
| Atlanta, GA | 10,822 | -5.8% | -5.3% |
| Austin, TX | 3,666 | -18.5% | 3.3% |
| Bakersfield, CA | 1,055 | 4.4% | 0.6% |
| Baltimore, MD | 4,690 | -3.9% | 0.1% |
| Baton Rouge, LA | 677 | -27.1% | -42.9% |
| Birmingham, AL | 1,472 | -11.6% | -12.4% |
| Boston, MA | 5,656 | -10.4% | 29.0% |
| Bridgeport, CT | 1,794 | -23.0% | 55.2% |
| Buffalo, NY | 1,628 | -0.4% | 9.6% |
| Camden, NJ | 2,231 | -2.2% | 7.8% |
| Charlotte, NC | 3,613 | -17.1% | -25.8% |
| Chicago, IL | 12,795 | -6.6% | 17.3% |
| Cincinnati, OH | 3,484 | -5.8% | 3.9% |
| Cleveland, OH | 3,277 | -7.2% | -0.2% |
| Columbus, OH | 3,284 | -6.2% | -1.6% |
| Dallas, TX | 7,200 | -12.5% | -2.4% |
| Dayton, OH | 1,343 | -4.2% | 5.7% |
| Denver, CO | 5,729 | -12.2% | 0.5% |
| Detroit, MI | 2,609 | -4.2% | -11.4% |
| El Paso, TX | 1,220 | 22.2% | 24.4% |
| Elgin, IL | 1,311 | -12.6% | 0.6% |
| Fort Lauderdale, FL | 3,523 | -5.4% | -2.1% |
| Fort Worth, TX | 3,608 | -9.8% | -0.7% |
| Frederick, MD | 1,949 | -3.3% | 18.8% |
| Fresno, CA | 944 | -0.4% | -6.0% |
| Grand Rapids, MI | 1,654 | -11.8% | -10.6% |
| Greensboro, NC | 672 | -14.7% | -35.4% |
| Greenville, SC | 1,289 | -15.1% | -10.5% |
| Hartford, CT | 1,986 | -7.0% | 12.5% |
| Honolulu, HI | 802 | -9.8% | -26.2% |
| Houston, TX | 9,998 | -14.4% | -0.6% |
| Indianapolis, IN | 3,521 | -4.1% | -1.8% |
| Jacksonville, FL | 2,856 | -4.4% | -4.9% |
| Kansas City, MO | 1,759 | -43.9% | -54.5% |
| Knoxville, TN | 1,152 | -15.5% | -22.5% |
| Lake County, IL | 1,594 | -11.8% | 11.8% |
| Las Vegas, NV | 4,617 | 4.7% | 3.2% |
| Los Angeles, CA | 8,270 | -2.4% | 11.2% |
| Louisville, KY | 1,570 | -9.7% | -6.5% |
| McAllen, TX | 401 | 6.1% | -14.3% |
| Memphis, TN | 1,350 | -1.7% | -4.7% |
| Miami, FL | 3,707 | -1.7% | -2.0% |
| Milwaukee, WI | 2,522 | -0.1% | 8.3% |
| Minneapolis, MN | 7,236 | -2.8% | 6.2% |
| Montgomery County, PA | 2,867 | -14.4% | 10.9% |
| Nashville, TN | 4,417 | -5.1% | 1.7% |
| Nassau County, NY | 4,148 | -8.7% | 27.5% |
| New Brunswick, NJ | 4,840 | -7.1% | 25.8% |
| New Haven, CT | 1,463 | -2.6% | 28.0% |
| New Orleans, LA | 1,541 | -8.8% | 0.5% |
| New York, NY | 10,519 | -13.4% | 66.3% |
| Newark, NJ | 3,218 | -8.8% | 38.7% |
| North Port, FL | 2,392 | -0.2% | 15.3% |
| Oakland, CA | 2,888 | -8.3% | 11.1% |
| Oklahoma City, OK | 2,361 | -9.8% | -3.5% |
| Omaha, NE | 1,279 | -14.9% | -16.4% |
| Orlando, FL | 4,687 | -7.0% | 6.0% |
| Oxnard, CA | 910 | -7.5% | 9.1% |
| Philadelphia, PA | 3,258 | -4.1% | 22.1% |
| Phoenix, AZ | 9,482 | 1.4% | 6.9% |
| Pittsburgh, PA | 2,997 | -11.2% | 10.9% |
| Portland, OR | 4,239 | -9.2% | 7.8% |
| Providence, RI | 2,520 | -0.7% | 5.5% |
| Raleigh, NC | 2,728 | -12.3% | 1.6% |
| Richmond, VA | 1,889 | -7.4% | 2.7% |
| Riverside, CA | 6,251 | 3.6% | 2.6% |
| Rochester, NY | 1,479 | 0.2% | 3.6% |
| Sacramento, CA | 3,518 | -2.0% | -3.5% |
| Salt Lake City, UT | 971 | -40.2% | -50.2% |
| San Antonio, TX | 3,411 | -10.8% | -6.5% |
| San Diego, CA | 3,971 | -6.8% | 5.3% |
| San Francisco, CA | 1,627 | 4.6% | 75.9% |
| San Jose, CA | 1,596 | 16.0% | 24.0% |
| Seattle, WA | 5,871 | -1.5% | 35.2% |
| St. Louis, MO | 2,565 | -34.2% | -39.4% |
| Tacoma, WA | 1,732 | -7.0% | 6.0% |
| Tampa, FL | 6,014 | -5.2% | -2.7% |
| Tucson, AZ | 1,726 | 3.3% | 5.4% |
| Tulsa, OK | 1,557 | -3.9% | 8.1% |
| Virginia Beach, VA | 2,780 | -11.9% | 3.4% |
| Warren, MI | 5,060 | -4.6% | 0.2% |
| Washington, D.C. | 7,992 | -8.2% | 17.4% |
| West Palm Beach, FL | 3,604 | -4.4% | 15.8% |
| Worcester, MA | 1,385 | 7.4% | 4.9% |
| National | 641,900 | 2.2% | 4.6% |
All Homes for Sale
| Redfin Metro | All Homes for Sale | Month-Over-Month | Year-Over-Year |
|---|---|---|---|
| Albany, NY | 3,300 | -1.9% | -26.2% |
| Allentown, PA | 1,619 | -23.7% | -55.0% |
| Anaheim, CA | 10,205 | -2.5% | -18.3% |
| Atlanta, GA | 30,055 | -7.3% | -22.3% |
| Austin, TX | 8,997 | -9.9% | -22.9% |
| Bakersfield, CA | 2,380 | -0.8% | -23.6% |
| Baltimore, MD | 11,495 | -5.3% | -27.4% |
| Baton Rouge, LA | 2,952 | -15.6% | -42.8% |
| Birmingham, AL | 4,981 | -6.7% | -25.6% |
| Boston, MA | 14,066 | -4.9% | -7.4% |
| Bridgeport, CT | 7,348 | -5.5% | -4.1% |
| Buffalo, NY | 3,005 | 0.1% | -21.3% |
| Camden, NJ | 5,408 | -6.8% | -35.2% |
| Charlotte, NC | 12,065 | -11.5% | -30.7% |
| Chicago, IL | 35,955 | -1.7% | -17.8% |
| Cincinnati, OH | 9,864 | -2.4% | -16.5% |
| Cleveland, OH | 8,439 | -4.5% | -30.1% |
| Columbus, OH | 8,670 | -2.6% | -15.6% |
| Dallas, TX | 21,115 | -9.6% | -24.3% |
| Dayton, OH | 3,173 | -2.5% | -16.5% |
| Denver, CO | 11,622 | -7.1% | -20.3% |
| Detroit, MI | 6,654 | -4.8% | -24.9% |
| El Paso, TX | 3,158 | 1.7% | -16.1% |
| Elgin, IL | 3,273 | -7.1% | -29.6% |
| Fort Lauderdale, FL | 15,531 | -4.7% | -8.5% |
| Fort Worth, TX | 9,625 | -8.3% | -19.3% |
| Frederick, MD | 4,509 | -6.2% | -16.4% |
| Fresno, CA | 1,800 | -5.1% | -35.8% |
| Grand Rapids, MI | 3,443 | -6.0% | -23.8% |
| Greensboro, NC | 2,291 | -13.6% | -36.7% |
| Greenville, SC | 4,846 | -4.7% | -18.0% |
| Hartford, CT | 6,209 | -5.0% | -21.2% |
| Honolulu, HI | 3,785 | -6.3% | -23.4% |
| Houston, TX | 31,534 | -7.2% | -20.7% |
| Indianapolis, IN | 7,090 | -1.4% | -26.3% |
| Jacksonville, FL | 8,706 | -7.6% | -21.1% |
| Kansas City, MO | 5,215 | -26.1% | -53.0% |
| Knoxville, TN | 4,310 | -8.4% | -20.3% |
| Lake County, IL | 4,791 | -5.0% | -27.4% |
| Las Vegas, NV | 13,435 | -0.4% | -18.4% |
| Los Angeles, CA | 23,777 | -0.7% | -13.5% |
| Louisville, KY | 3,728 | -7.3% | -27.5% |
| McAllen, TX | 1,545 | -10.3% | -34.9% |
| Memphis, TN | 3,434 | -5.2% | -26.4% |
| Miami, FL | 19,090 | -3.7% | -8.9% |
| Milwaukee, WI | 7,306 | -0.3% | -5.2% |
| Minneapolis, MN | 16,093 | -1.3% | -13.2% |
| Montgomery County, PA | 7,497 | -9.8% | -19.5% |
| Nashville, TN | 12,959 | -4.5% | -17.6% |
| Nassau County, NY | 12,834 | -6.1% | -17.2% |
| New Brunswick, NJ | 13,208 | -4.6% | -24.0% |
| New Haven, CT | 4,540 | -1.6% | -16.8% |
| New Orleans, LA | 4,819 | -7.3% | -21.2% |
| New York, NY | 44,532 | 5.3% | 10.0% |
| Newark, NJ | 10,084 | -2.0% | -14.6% |
| North Port, FL | 7,186 | -6.2% | -14.6% |
| Oakland, CA | 5,822 | -5.5% | -14.1% |
| Oklahoma City, OK | 5,943 | -6.0% | -21.6% |
| Omaha, NE | 2,602 | -8.3% | -24.4% |
| Orlando, FL | 13,021 | -4.6% | -10.9% |
| Oxnard, CA | 2,735 | -4.5% | -18.7% |
| Philadelphia, PA | 9,442 | -2.1% | -3.3% |
| Phoenix, AZ | 21,895 | -4.4% | -15.0% |
| Pittsburgh, PA | 11,111 | -5.3% | -6.6% |
| Portland, OR | 9,110 | -3.0% | -21.9% |
| Providence, RI | 6,354 | -1.2% | -24.3% |
| Raleigh, NC | 8,108 | -6.5% | -15.2% |
| Richmond, VA | 3,980 | -7.4% | -26.0% |
| Riverside, CA | 16,140 | -5.7% | -30.5% |
| Rochester, NY | 2,763 | -3.3% | -21.9% |
| Sacramento, CA | 7,137 | -5.3% | -27.3% |
| Salt Lake City, UT | 2,628 | -28.0% | -50.5% |
| San Antonio, TX | 10,037 | -8.7% | -26.0% |
| San Diego, CA | 8,643 | -4.9% | -23.0% |
| San Francisco, CA | 4,165 | 11.7% | 75.0% |
| San Jose, CA | 3,488 | 4.4% | -7.8% |
| Seattle, WA | 10,881 | 2.6% | -9.5% |
| St. Louis, MO | 8,810 | -17.5% | -37.2% |
| Tacoma, WA | 3,076 | -1.8% | -20.4% |
| Tampa, FL | 14,351 | -8.2% | -26.5% |
| Tucson, AZ | 4,738 | -5.0% | -15.2% |
| Tulsa, OK | 3,827 | -2.5% | -21.0% |
| Virginia Beach, VA | 6,865 | -9.4% | -29.4% |
| Warren, MI | 11,864 | -2.4% | -20.0% |
| Washington, D.C. | 18,744 | -3.4% | -10.8% |
| West Palm Beach, FL | 15,623 | -3.6% | -2.5% |
| Worcester, MA | 3,057 | -2.6% | -28.0% |
| National | 1,677,400 | -2.3% | -22.0% |
Median Off-Market Redfin Estimate
| Redfin Metro | Estimate | Month-Over-Month | Year-Over-Year |
|---|---|---|---|
| Albany, NY | $202,100 | 1.0% | -8.6% |
| Allentown, PA | $217,300 | 1.1% | -1.2% |
| Anaheim, CA | $745,600 | 0.6% | 2.1% |
| Atlanta, GA | $238,700 | 1.0% | 2.6% |
| Austin, TX | $308,400 | 0.7% | -3.7% |
| Bakersfield, CA | $201,900 | 1.1% | -10.4% |
| Baltimore, MD | $277,100 | 1.0% | 3.8% |
| Baton Rouge, LA | $131,500 | 0.6% | -23.7% |
| Birmingham, AL | $138,600 | 1.0% | -10.3% |
| Boston, MA | $538,300 | 1.0% | 7.7% |
| Bridgeport, CT | $396,700 | 0.5% | -31.3% |
| Buffalo, NY | $155,300 | 0.9% | -5.8% |
| Camden, NJ | $212,300 | 1.3% | 4.1% |
| Charlotte, NC | $217,100 | 1.0% | 3.3% |
| Chicago, IL | $266,000 | 0.7% | 5.9% |
| Cincinnati, OH | $170,500 | 1.1% | -3.6% |
| Cleveland, OH | $145,700 | 1.1% | 0.4% |
| Columbus, OH | $205,400 | 1.2% | 3.0% |
| Dallas, TX | $262,800 | 0.6% | -1.0% |
| Dayton, OH | $129,600 | 0.9% | 5.2% |
| Denver, CO | $428,500 | 0.6% | 2.7% |
| Detroit, MI | $110,300 | 1.6% | 0.3% |
| Elgin, IL | $234,700 | 0.8% | 1.2% |
| Fort Lauderdale, FL | $279,300 | 0.7% | 2.7% |
| Fort Worth, TX | $225,600 | 0.8% | 0.7% |
| Frederick, MD | $422,700 | 0.8% | 3.6% |
| Fresno, CA | $267,700 | 1.1% | 2.0% |
| Grand Rapids, MI | $178,000 | 1.1% | 4.3% |
| Greensboro, NC | $141,000 | 1.1% | -4.4% |
| Greenville, SC | $165,300 | 0.9% | -14.5% |
| Hartford, CT | $227,900 | 0.6% | -31.9% |
| Honolulu, HI | $703,000 | 0.1% | 1.2% |
| Houston, TX | $203,100 | 0.9% | -5.2% |
| Indianapolis, IN | $170,400 | 1.1% | 0.4% |
| Jacksonville, FL | $217,500 | 0.8% | -4.8% |
| Kansas City, MO | $188,700 | 1.1% | -1.7% |
| Knoxville, TN | $184,100 | 1.2% | 2.2% |
| Lake County, IL | $222,700 | 1.1% | -2.8% |
| Las Vegas, NV | $289,900 | 0.6% | 2.9% |
| Los Angeles, CA | $658,800 | 0.7% | 3.4% |
| Louisville, KY | $182,000 | 1.1% | 2.8% |
| Memphis, TN | $153,200 | 1.1% | 3.8% |
| Miami, FL | $320,000 | 0.5% | 3.8% |
| Milwaukee, WI | $213,900 | 1.5% | 7.4% |
| Minneapolis, MN | $280,700 | 1.0% | 2.6% |
| Montgomery County, PA | $331,900 | 1.1% | 2.1% |
| Nashville, TN | $285,000 | 0.7% | 5.3% |
| Nassau County, NY | $492,400 | 1.3% | 4.8% |
| New Brunswick, NJ | $352,100 | 0.7% | 3.7% |
| New Haven, CT | $227,600 | 0.6% | -51.9% |
| New Orleans, LA | $175,100 | 1.0% | -7.4% |
| Newark, NJ | $374,900 | 0.9% | -0.1% |
| North Port, FL | $241,300 | 0.6% | -10.0% |
| Oakland, CA | $793,200 | 0.9% | 2.4% |
| Oklahoma City, OK | $150,000 | 0.8% | -2.6% |
| Omaha, NE | $195,100 | 1.1% | 6.9% |
| Orlando, FL | $240,800 | 0.7% | -0.8% |
| Oxnard, CA | $612,300 | 0.9% | 0.7% |
| Philadelphia, PA | $198,000 | 1.3% | 2.6% |
| Phoenix, AZ | $282,100 | 1.1% | 0.7% |
| Pittsburgh, PA | $137,800 | 3.0% | -11.4% |
| Portland, OR | $409,500 | 0.8% | 0.8% |
| Providence, RI | $303,500 | 1.1% | -0.2% |
| Raleigh, NC | $264,800 | 0.8% | -4.1% |
| Richmond, VA | $243,400 | 0.8% | 4.0% |
| Riverside, CA | $340,400 | 1.3% | -9.0% |
| Rochester, NY | $148,900 | 0.9% | -2.6% |
| Sacramento, CA | $422,700 | 0.9% | 0.2% |
| Salt Lake City, UT | $367,300 | 1.2% | 7.5% |
| San Antonio, TX | $188,200 | 0.8% | -7.3% |
| San Diego, CA | $621,000 | 0.9% | 2.9% |
| San Francisco, CA | $1,374,800 | 0.1% | 2.1% |
| San Jose, CA | $1,170,200 | 0.6% | 0.3% |
| Seattle, WA | $581,400 | 0.9% | 1.0% |
| St. Louis, MO | $163,100 | 1.0% | -2.6% |
| Tacoma, WA | $380,800 | 1.0% | 2.1% |
| Tampa, FL | $227,100 | 1.0% | -1.0% |
| Tucson, AZ | $211,000 | 1.2% | -5.6% |
| Tulsa, OK | $136,200 | 1.1% | -5.5% |
| Virginia Beach, VA | $238,900 | 0.9% | 4.0% |
| Warren, MI | $216,900 | 1.3% | 2.2% |
| Washington, D.C. | $410,200 | 0.8% | 2.6% |
| West Palm Beach, FL | $282,200 | 0.6% | 2.3% |
| Worcester, MA | $290,400 | 1.0% | -1.7% |
| National | $315,800 | 2.1% | 4.4% |
The post Home Prices Rose 11% in August—Biggest Gain in Over 6 Years appeared first on Redfin | Real Estate Tips for Home Buying, Selling & More.