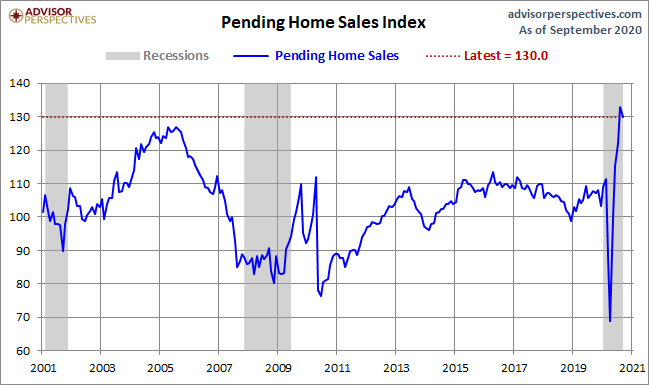
Today the National Association of Realtors reported pending home sales are up 20.5% year over year — and that is the only headline that you should care about.

This is one more data point showing that housing data has gone wild to the upside, so we should expect some downward moderation in the month-to-month data. Similarly, the recent Census/HUD report on new home sales showed they were up 32.1% year over year, whereas the monthly numbers showed a decline of 3.5% from August to September. I expected the negative revisions in the monthly numbers to be even larger, so these numbers may be revised lower yet again.
Month-to-month housing data can move up and down, but the trend is what matters most. For this reason, I recommend just focusing on the year-over-year data. Focusing on the year-over-year data with home sales and especially with purchase applications is the key to understanding the market trends.
When reading all the housing market chatter out there, it is wise to keep in mind that our extreme housing bears are fragile people. When they see a move lower in the data they think this is 2008 all over again, but that is just not happening this year.
After February’s existing home sales report, I would have expected the existing home sales data to have ended the year in the range of 5,710,000 to 5,840,000. We have a ways to go to get into that ballpark with only three reports left in the year. If we don’t reach those numbers, then COVID-19 did take some demand off the market in the existing home sales data.
Purchase application data, which looks out 30-90 days, has been averaging over 20% year over year for 23 straight weeks. The last four weeks of growth on a year-over-year basis look like this:
+24%
+26%
+24%
+21%
If you were looking for a W in housing, your hopes died as of May of 2020. It has been all V-territory since then. Please don’t make the rookie mistake of moderation equally a W.
Remember, that in the previous expansion we have had our best existing home sales print in the fall and winter, not the spring or summer so we are pushing our way to achieve a positive year in existing home sales. If we don’t reach 5,710,000 in total existing-home sales then we can blame COVID-19 for the hit in demand.
While new home sales are up 16.9% year to date, the existing home sales market is still down 0.2%. Still, it’s going to be a 6 million+ total home sales year — even with the global pandemic. This makes the U.S. housing market the most outperforming economic sector in the world.
The post Pending home sales fell in September, but annual gain is the important metric appeared first on HousingWire.
